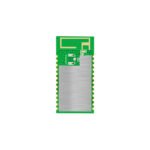

Indoor positioning remains one of the highest-value applications for Bluetooth beacons. GPS signals attenuate below concrete ceilings, leaving beacon-based systems as the primary indoor alternative. This article compares the two dominant positioning algorithms — RSSI trilateration and fingerprinting — with real-world accuracy data and deployment trade-offs.
RSSI and Path Loss
All beacon positioning relies on Received Signal Strength Indicator (RSSI), measured in dBm. The fundamental relationship between RSSI and distance follows a log-normal path loss model:
RSSI(d) = A - 10 * n * log10(d)
Where:
- A: RSSI at 1 meter reference distance (typically -60 to -70 dBm for CR2032-powered beacons)
- n: path loss exponent (2.0 in free space, 2.7–3.5 in office environments, 4.0+ in cluttered industrial spaces)
- d: distance in meters
Solving for distance:
d = 10 ^ ((A - RSSI) / (10 * n))
The challenge: RSSI fluctuates ±5–8 dBm in indoor environments due to multipath fading, human body absorption, and antenna orientation. A 6 dBm error at 5 meters translates to a 40–60% distance error, making raw single-beacon ranging unreliable.
Approach 1: Trilateration
Trilateration estimates position by intersecting distance circles from at least three beacons. Each beacon provides a distance estimate via the path loss equation above.
Algorithm
- Collect RSSI from each visible beacon (average 5–10 samples to reduce noise)
- Convert RSSI to distance using the calibrated path loss model
- Solve the least-squares intersection of distance circles
For beacons at positions (xi, yi) with estimated distances di, the target position (x, y) minimizes:
F(x,y) = Σ [(x - xi)² + (y - yi)² - di²]²
This nonlinear least-squares problem is typically solved via Gauss-Newton iteration. Initial estimate can use the centroid of beacon positions.
Accuracy Benchmarks
Measured in a 12m × 8m office space with 6 ceiling-mounted beacons, CR2032-powered, transmitting at 0 dBm every 100 ms:
| Scenario | Beacons Visible | Median Error | 90th Percentile |
|---|---|---|---|
| Open office | 4–5 | 1.8 m | 3.5 m |
| Cubicle area | 3–4 | 2.6 m | 5.1 m |
| Corridor | 2–3 | 3.2 m | 6.8 m |
| With body shadowing | 3–4 | 4.1 m | 8.3 m |
Accuracy degrades significantly when fewer than 3 beacons are visible or when the user’s body shadows the line-of-sight path.
Calibration Requirements
Trilateration requires per-beacon calibration of the path loss parameters (A, n). A practical calibration procedure:
- Place a reference receiver at 1 m from each beacon, record 100 RSSI samples, compute median → A value
- Measure RSSI at 2 m, 5 m, 10 m along a clear path
- Fit n via linear regression on log10(d) vs RSSI
- Re-calibrate quarterly — battery voltage droop shifts TX power by 1–3 dBm over a beacon’s lifecycle
Approach 2: Fingerprinting
Fingerprinting bypasses the distance estimation step entirely. Instead, it builds a radio map of the space during an offline survey phase, then matches live RSSI observations against this map.
Offline Phase (Survey)
- Divide the floor plan into a grid (typical spacing: 1–2 meters)
- At each grid point, collect RSSI from all visible beacons for 10–30 seconds
- Store the RSSI vector and beacon ID list as a fingerprint
A 1000 m² floor with 1 m grid spacing yields ~1000 fingerprints. Each fingerprint contains 5–15 beacon RSSI values plus metadata (timestamp, orientation).
Online Phase (Positioning)
The most common matching algorithm is Weighted K-Nearest Neighbors (WKNN):
- Collect live RSSI vector from visible beacons (2–5 second window)
- Compute similarity (Euclidean distance or Tanimoto coefficient) to all fingerprints
- Select the K closest fingerprints (K = 3–5 typical)
- Weight each by inverse distance, compute weighted centroid of their positions
Accuracy Benchmarks
Same 12m × 8m office space, 6 beacons, 1 m grid spacing, WKNN with K=4:
| Scenario | Median Error | 90th Percentile | Survey Time |
|---|---|---|---|
| Open office | 1.1 m | 2.3 m | 2.5 hours |
| Cubicle area | 1.5 m | 3.0 m | 3.0 hours |
| Corridor | 1.3 m | 2.8 m | 1.5 hours |
| With body shadowing | 2.0 m | 4.2 m | — |
Fingerprinting consistently outperforms trilateration by 30–50% in median error, especially in cluttered environments where multipath dominates. The radio map implicitly captures multipath patterns that path loss models cannot model.
Head-to-Head Comparison
| Factor | Trilateration | Fingerprinting |
|---|---|---|
| Accuracy (median) | 1.8–4.1 m | 1.1–2.0 m |
| Setup time | ~30 min per beacon | 2–4 hours per floor |
| Beacon repositioning | Recalibrate A,n | Full re-survey |
| Environmental changes | Degrades gracefully | Requires re-survey |
| Computational cost | Low (matrix solve) | Moderate (KNN search) |
| Scalability | Excellent | Database grows linearly |
| Min beacons needed | 3 | 4+ recommended |
Hybrid Approach
Production systems often blend both techniques. A common hybrid pipeline:
- Use trilateration to get a coarse position estimate (3–5 m accuracy)
- Restrict fingerprint matching to a 5 m radius around the trilateration estimate
- Apply WKNN within this reduced search space
This reduces the fingerprint database search from ~1000 entries to ~50, cutting computation time by 80% while maintaining fingerprinting-level accuracy.
Beacon Density and Placement
Positioning accuracy depends heavily on beacon geometry. Key guidelines:
- Density: 1 beacon per 25–50 m² for 1–2 m accuracy; 1 per 100 m² for 3–5 m accuracy
- Placement height: 2.5–3.0 m ceiling mount provides best coverage uniformity
- Geometry: Avoid linear arrangements. Triangular/hexagonal tessellation minimizes geometric dilution of precision (GDOP)
- TX power: +4 to 0 dBm for indoor positioning. Higher power increases interference; lower power reduces range below useful thresholds
- Advertising interval: 100 ms for real-time tracking, 300–500 ms for periodic monitoring. Sub-100 ms intervals drain CR2032 batteries in 2–3 months
Filtering and Smoothing
Raw positioning estimates jitter significantly. A Kalman filter or particle filter smooths trajectories:
- Kalman filter: Models user motion as constant velocity. Reduces 90th percentile error by 20–30% with minimal computation. State vector: [x, y, vx, vy].
- Particle filter: Handles non-linear motion and multi-modal position distributions better. 500–1000 particles provide smooth tracking at 5 Hz update rate.
- Map constraints: Clamping filtered positions to walkable areas (excluding walls, obstacles) eliminates physically impossible jumps. Reduces median error by an additional 10–15%.
Common Deployment Mistakes
- Ins beacon count: Deploying only 2–3 beacons per zone. Trilateration needs 3+ visible; fingerprinting benefits from 4+ for robust matching.
- Ignoring orientation: Human body attenuates 2.4 GHz signals by 10–20 dB. Collecting fingerprints in only one orientation produces systematic bias when users face other directions.
- Stale fingerprints: Furniture rearrangement, new partitions, or even seasonal changes (humidity affects 2.4 GHz propagation) invalidate the radio map. Schedule quarterly re-surveys.
- Uncalibrated TX power: Beacon TX power varies ±3 dBm across units due to component tolerance. Measure and compensate per-beacon, or fingerprinting inherits the error.
- Over-filtering: Aggressive smoothing makes the system feel laggy. A good rule: filter time constant should not exceed 1 second for walking-speed applications.
Conclusion
For most indoor Bluetooth beacon positioning deployments, fingerprinting with WKNN matching delivers 30–50% better accuracy than trilateration, at the cost of longer setup time. The hybrid approach — trilateration for coarse estimation, fingerprinting for refinement — offers the best balance of accuracy, computation, and maintainability. Regardless of algorithm choice, beacon density, geometry, and per-unit calibration matter more than the choice of algorithm itself.